Market Outlook
August 04, 2017
Market Cues
Domestic Indices
Chg (%)
(Pts)
(Close)
Indian markets are likely to open flat tracking global indices and SGX Nifty.
BSE Sensex
(0.7)
(239)
32,238
U.S. markets had another mixed session as investors awaited the Labor Department's
Nifty
(0.7)
(68)
10,014
monthly jobs report on Friday. A slight decrease was seen in first-time claims for
Mid Cap
(0.5)
(77)
15,335
unemployment benefits in the week ended July 29th. The initial jobless claims dipped
Small Cap
(0.9)
(152)
15,911
to 240,000 against an expectation of 242,000.
Bankex
(1.7)
(470)
27,886
UK markets moved higher after the Bank of England voted to keep interest rates
unchanged. U.K. service sector index came in at 53.8 for the month of July against
Global Indices
Chg (%)
(Pts)
(Close)
an expectation of 53.6. Gold producer Randgold Resources climbed 3.3% after
reporting a good set of numbers for first-half of the financial year.
Dow Jones
0.0
110
22,026
Nasdaq
(0.4)
(22)
6,340
Indian markets closed lower as banking stocks fell due to pressure on their net interest
FTSE
0.9
63
7,475
margins. Services PMI for the month of July fell to 45.9 its lowest level in nearly four
Nikkei
(0.3)
(51)
20,029
years. The Oil & gas index was the major gainer for the session and closed up 1.35
percent.
Hang Seng
(0.3)
(76)
27,531
Shanghai Com
(0.4)
(12)
3,273
News Analysis
BPCL refinery in Kochi to be commissioned by end of August
Advances / Declines
BSE
NSE
Detailed analysis is on Pg2
Advances
1,800
1,435
Investor’s Ready Reckoner
Declines
1,845
1,246
Unchanged
147
68
Key Domestic & Global Indicators
Stock Watch: Latest investment recommendations on 150+ stocks
Volumes (` Cr)
Refer Pg7 onwards
BSE
3,950
Top Picks
NSE
27,705
CMP
Target
Upside
Company
Sector
Rating
(`)
(`)
(%)
Blue Star
Capital Goods
Accumulate
677
760
12.2
#Net Inflows (` Cr)
Net
Mtd
Ytd
Dewan Housing FinanceFinancials
Buy
451
550
22.0
FII
(56568
(2(352)
58,045
Mahindra Lifespace
Real Estate
Buy
423
522
23.5
MFs
8(25)
1,626
52,572
Navkar Corporation
Others
Buy
197
265
34.4
KEI Industries
Capital Goods
Accumulate
226
258
14.1
More Top Picks on Pg5
Top Gainers
Price (`)
Chg (%)
Key Upcoming Events
Fortiscem
164
7.0
Previous
Consensus
Date
Region
Event Description
Bataindia
622
6.6
Reading
Expectations
Edelweiss
226
5.2
Aug 04, 2017 UK
BOE Announces rates
0.25
0.25
Aug 04, 2017 US
Unemployment rate
4.40
4.30
Videoind
24
4.9
Aug 08, 2017 India
Imports YoY%
19.00
Godrejcp
970
4.8
Aug 09, 2017 China
Exports YoY%
11.30
11.00
Aug 10, 2017 China
Consumer Price Index (YoY)
1.50
1.50
Top Losers
Price (`)
Chg (%)
More Events on Pg7
Jindalstel
142
(10.1)
Unitech
7
(8.9)
Rcom
23
(7.8)
Pnb
149
(6.0)
Syndibank
70
(4.4)
rd Aug, 2017
Market Outlook
August 04, 2017
News Analysis
BPCL refinery in Kochi to be commissioned by end of August
The final commissioning of the expansion project of Bharat Petroleum Corporation
Ltd (BPCL) Kochi refinery is expected to happen by the end of August. This expansion
was originally expected to cost around
`16,800cr, but was completed at
approximately `16,000cr. With the final commissioning, the expected capacity of
the facility is expected to go up from 9.5 mln metric tonnes per annum (mmtpa) to
15.5 mmtpa.
The company is also looking at setting up an LNG terminal as they are keen on
tapping the growing opportunity in the gas fuel market in the country.
BPCL also announced that the company has revised the dealers' commission
structure. This would help it to improve the company’s brand image and as well as
provide benefits to the dealers, employees working in the petrol pumps and the
customers.
Economic and Political News
Tamil Nadu state govt. to come up with new IT policy
Agriculture ministry receives `16,094cr in the April-June for various schemes;
an increase of 53% YoY
New law to regulate chit fund schemes: Finance Minister
Corporate News
Lupin receives USFDA approval to market Rosuvastatin Calcium tablets; a
cholesterol-lowering drug
Ramco Cements reports flat growth of net profit of `156cr in Q1FY18
Tejas Networks reports profit of `20cr in Q1FY18; sees reveneue growth of 54%
YoY
BPCL refinery in Kochi to be commissioned by end of August
Infosys to acquire Brilliant Basics, a UK-based product design and customer
experience firm, for an undisclosed amount
Market Outlook
August 04, 2017
Quarterly Bloomberg Brokers Consensus Estimate
Hindustan Petroleum Corp Ltd - Aug 4, 2017
Particulars ( `cr)
1QFY18E
1QFY17
y-o-y (%)
4QFY17 q-o-q (%)
Net sales
51,338
44,779
14.6
51,414
(0.1)
EBITDA
2,109
3,627
(41.8)
2,886
(26.9)
EBITDA margin (%)
4.1
8.1
5.6
Net profit
1,107
2,098
(47.2)
1,819
(39.1)
Dabur India Ltd Consol - Aug 4, 2017
Particulars ( `cr)
1QFY18E
1QFY17
y-o-y (%)
4QFY17 q-o-q (%)
Net sales
1,826
1,924
(5.1)
1,915
(4.6)
EBITDA
323
349
(7.5)
418
(22.7)
EBITDA margin (%)
17.7
18.1
21.8
Net profit
272
293
(7.2)
333
(18.5)
Mahindra & Mahindra Ltd - Aug 4, 2017
Particulars ( `cr)
1QFY18E
1QFY17
y-o-y (%)
4QFY17 q-o-q (%)
Net sales
11,153
10,898
2.3
11,125
0.3
EBITDA
1,548
1,286
20.4
938
64.9
EBITDA margin (%)
13.9
11.8
8.4
Net profit
898
1,014
(11.5)
631
42.1
Market Outlook
August 04, 2017
Top Picks
Market Cap
CMP
Target
Upside
Company
Rationale
(` Cr)
(`)
(`)
(%)
Strong growth in domestic business due to its leadership
in acute therapeutic segment. Alkem expects to launch
Alkem Laboratories
21,583
1,805
2,161
19.7
more products in USA, which bodes for its international
business.
We expect the company would report strong profitability
Asian Granito
1,226
408
480
17.8
owing to better product mix, higher B2C sales and
amalgamation synergy.
Favourable outlook for the AC industry to augur well for
Cooling products business which is out pacing the market
Blue Star
6,485
677
760
12.2
growth. EMPPAC division's profitability to improve once
operating environment turns around.
With a focus on the low and medium income (LMI)
consumer segment, the company has increased its
Dewan Housing Finance
14,136
451
550
22.0
presence in tier-II & III cities where the growth opportunity
is immense.
Loan growth is likely to pick up after a sluggish FY17.
Karur Vysya Bank
8,294
137
160
16.6
Lower credit cost will help in strong bottomline growth.
Increasing share of CASA will help in NIM improvement.
High order book execution in EPC segment, rising B2C
KEI Industries
1,759
226
258
14.1
sales and higher exports to boost the revenues and
profitability
Speedier execution and speedier sales, strong revenue
Mahindra Lifespace
2,169
423
522
23.5
visibilty in short-to-long run, attractive valuations
Massive capacity expansion along with rail advantage at
Navkar Corporation
2,812
197
265
34.4
ICD as well CFS augurs well for the company
Strong brands and distribution network would boost
Siyaram Silk Mills
1,966
2,097
2,500
19.2
growth going ahead. Stock currently trades at an
inexpensive valuation.
Market leadership in Hindi news genre and no.
2
viewership ranking in English news genre, exit from the
TV Today Network
1,437
241
344
42.8
radio business, and anticipated growth in ad spends by
corporates to benefit the stock.
After GST, the company is expected to see higher volumes
along with improving product mix. The Gujarat plant will
Maruti
2,33,780
7,739
8,495
9.8
also enable higher operating leverage which will be
margin accretive.
Source: Company, Angel Research,
Market Outlook
August 04, 2017
Key Upcoming Events
Result Calendar
Date
Company
August 04, 2017
M&M, Apollo Tyres, Andhra Bank, Dabur India, HPCL, MRF, Kirloskar Engines India Ltd, VRL Logistics
August 05, 2017
Syndicate Bank, Sarda Energy, Relaxo
Source: Bloomberg, Angel Research
Global economic events release calendar
Bloomberg Data
Date
Time
Country
Event Description
Unit
Period
Last Reported
Estimated
Aug 04, 2017
4:30 PMUK
BOE Announces rates
% Ratio
Aug 3
0.25
0.25
6:00 PMUS
Unnemployment rate
%
Jul
4.40
4.30
Aug 08, 2017
India
Imports YoY%
% Change
Jul
19.00
Aug 09, 2017
China
Exports YoY%
% Change
Jul
11.30
11.00
Aug 10, 2017
7:00 AMChina
Consumer Price Index (YoY)
% Change
Jul
1.50
1.50
India
Exports YoY%
% Change
Jul
4.40
US
Producer Price Index (mom)
% Change
Jul
0.20
2:00 PMUK
Industrial Production (YoY)
% Change
Jun
(0.20)
(0.30)
Aug 11, 2017
6:00 PMUS
Consumer price index (mom)
% Change
Jul
-
0.10
5:30 PMIndia
Industrial Production YoY
% Change
Jun
1.70
Aug 14, 2017
7:30 AMChina
Industrial Production (YoY)
% Change
Jul
7.60
7.10
12:00 PMIndia
Monthly Wholesale Prices YoY%
% Change
Jul
0.90
Aug 15, 2017
2:00 PMUK
CPI (YoY)
% Change
Jul
2.60
11:30 AMGermany GDP nsa (YoY)
% Change
2Q P
2.90
Aug 16, 2017
6:00 PMUS
Housing Starts
Thousands
Jul
1,215.00
1,220.00
Source: Bloomberg, Angel Research
Market Outlook
August 04, 2017
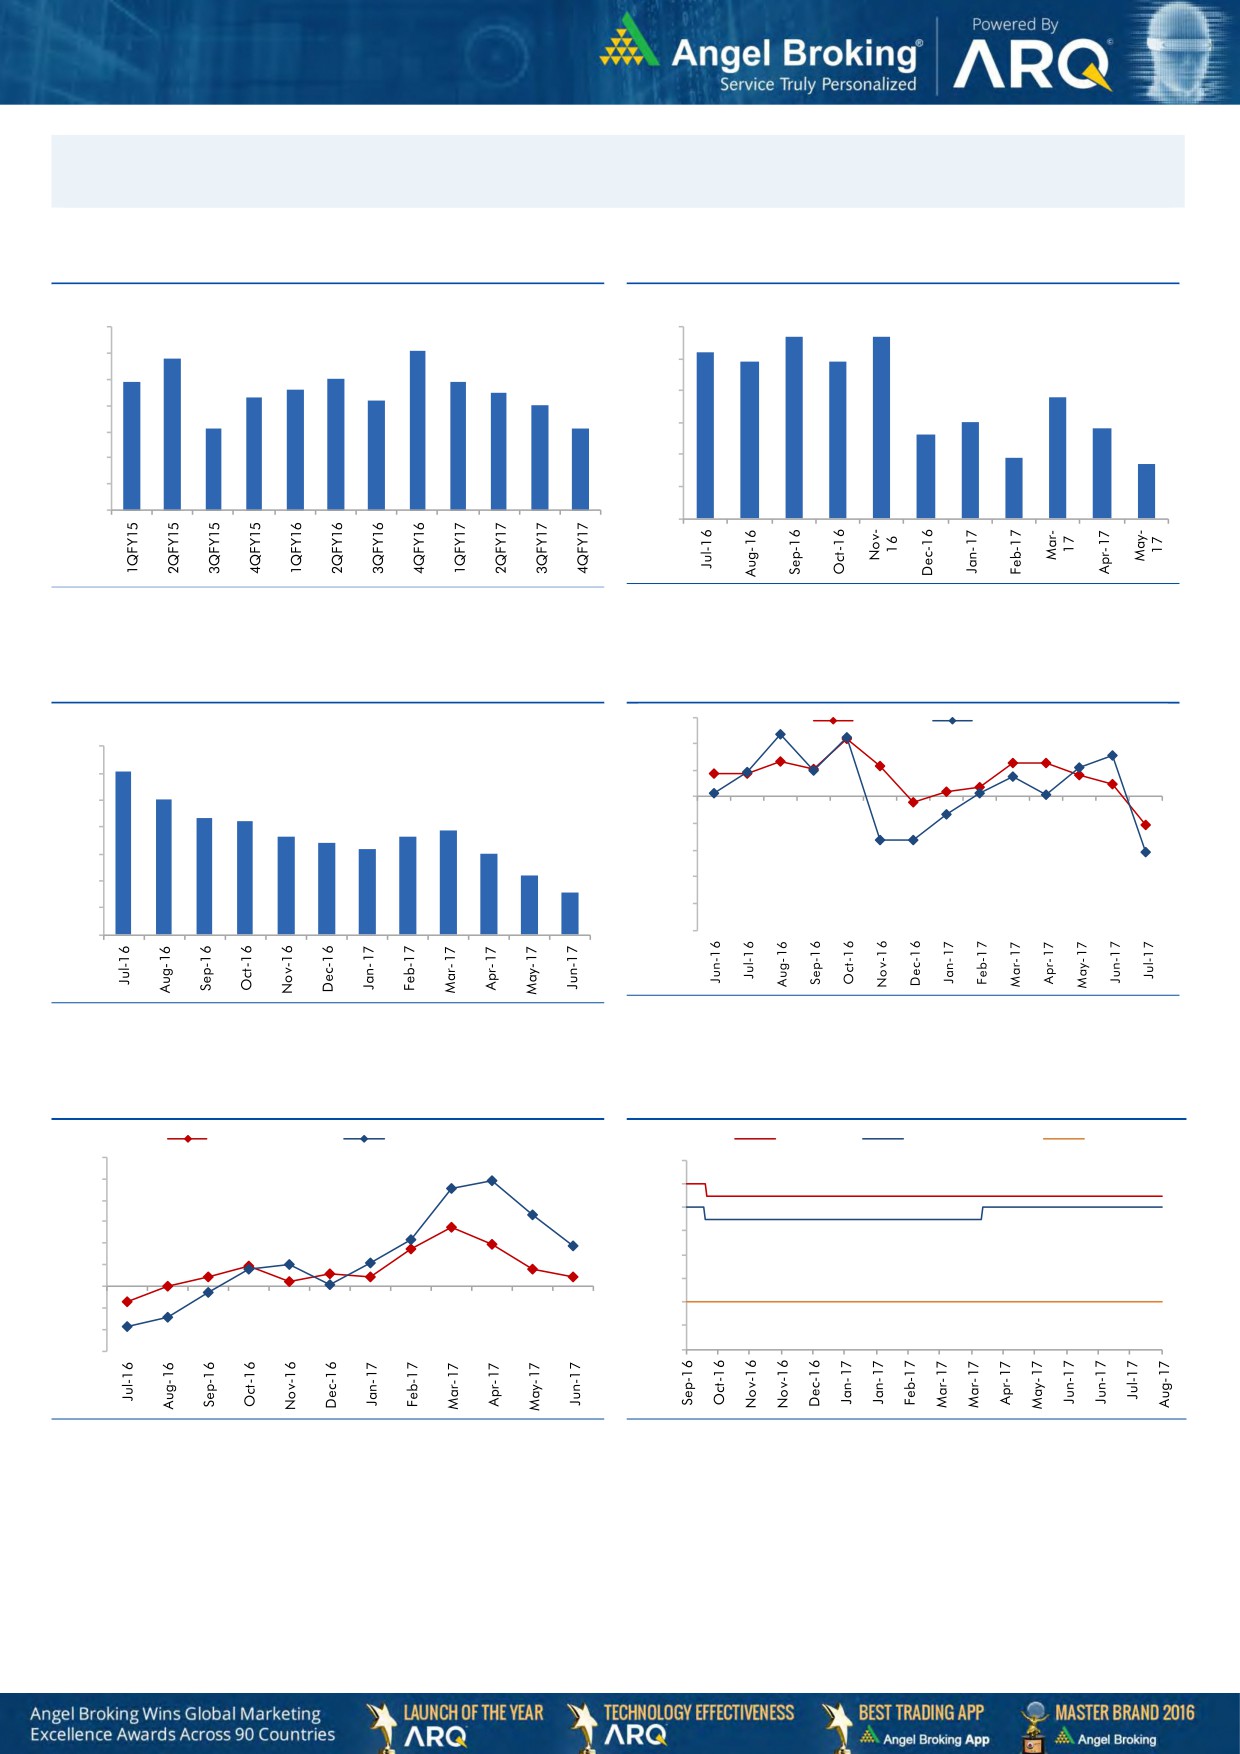
Macro watch
Exhibit 1: Quarterly GDP trends
Exhibit 2: IIP trends
(%)
(%)
5.7
5.7
10.0
6.0
9.1
5.2
8.8
4.9
4.9
9.0
7.9
8.0
7.9
5.0
7.6
7.5
8.0
7.3
7.2
3.8
7.0
4.0
7.0
3.0
6.1
6.1
2.8
3.0
2.6
6.0
1.9
1.7
5.0
2.0
4.0
1.0
3.0
-
Source: CSO, Angel Research
Source: MOSPI, Angel Research
Exhibit 3: Monthly CPI inflation trends
Exhibit 4: Manufacturing and services PMI
56.0
Mfg. PMI
Services PMI
(%)
7.0
54.0
6.1
6.0
52.0
5.1
5.0
50.0
4.3
4.2
3.9
3.6
3.7
4.0
3.4
48.0
3.2
3.0
3.0
46.0
2.2
2.0
1.5
44.0
1.0
42.0
-
40.0
Source: Market, Angel Research; Note: Level above 50 indicates expansion
Source: MOSPI, Angel Research
Exhibit 5: Exports and imports growth trends
Exhibit 6: Key policy rates
(%)
Exports yoy growth
Imports yoy growth
(%)
Repo rate
Reverse Repo rate
CRR
60.0
7.00
50.0
6.50
40.0
6.00
30.0
5.50
20.0
5.00
10.0
4.50
0.0
4.00
(10.0)
(20.0)
3.50
(30.0)
3.00
Source: Bloomberg, Angel Research
Source: RBI, Angel Research
Market Outlook
August 04, 2017
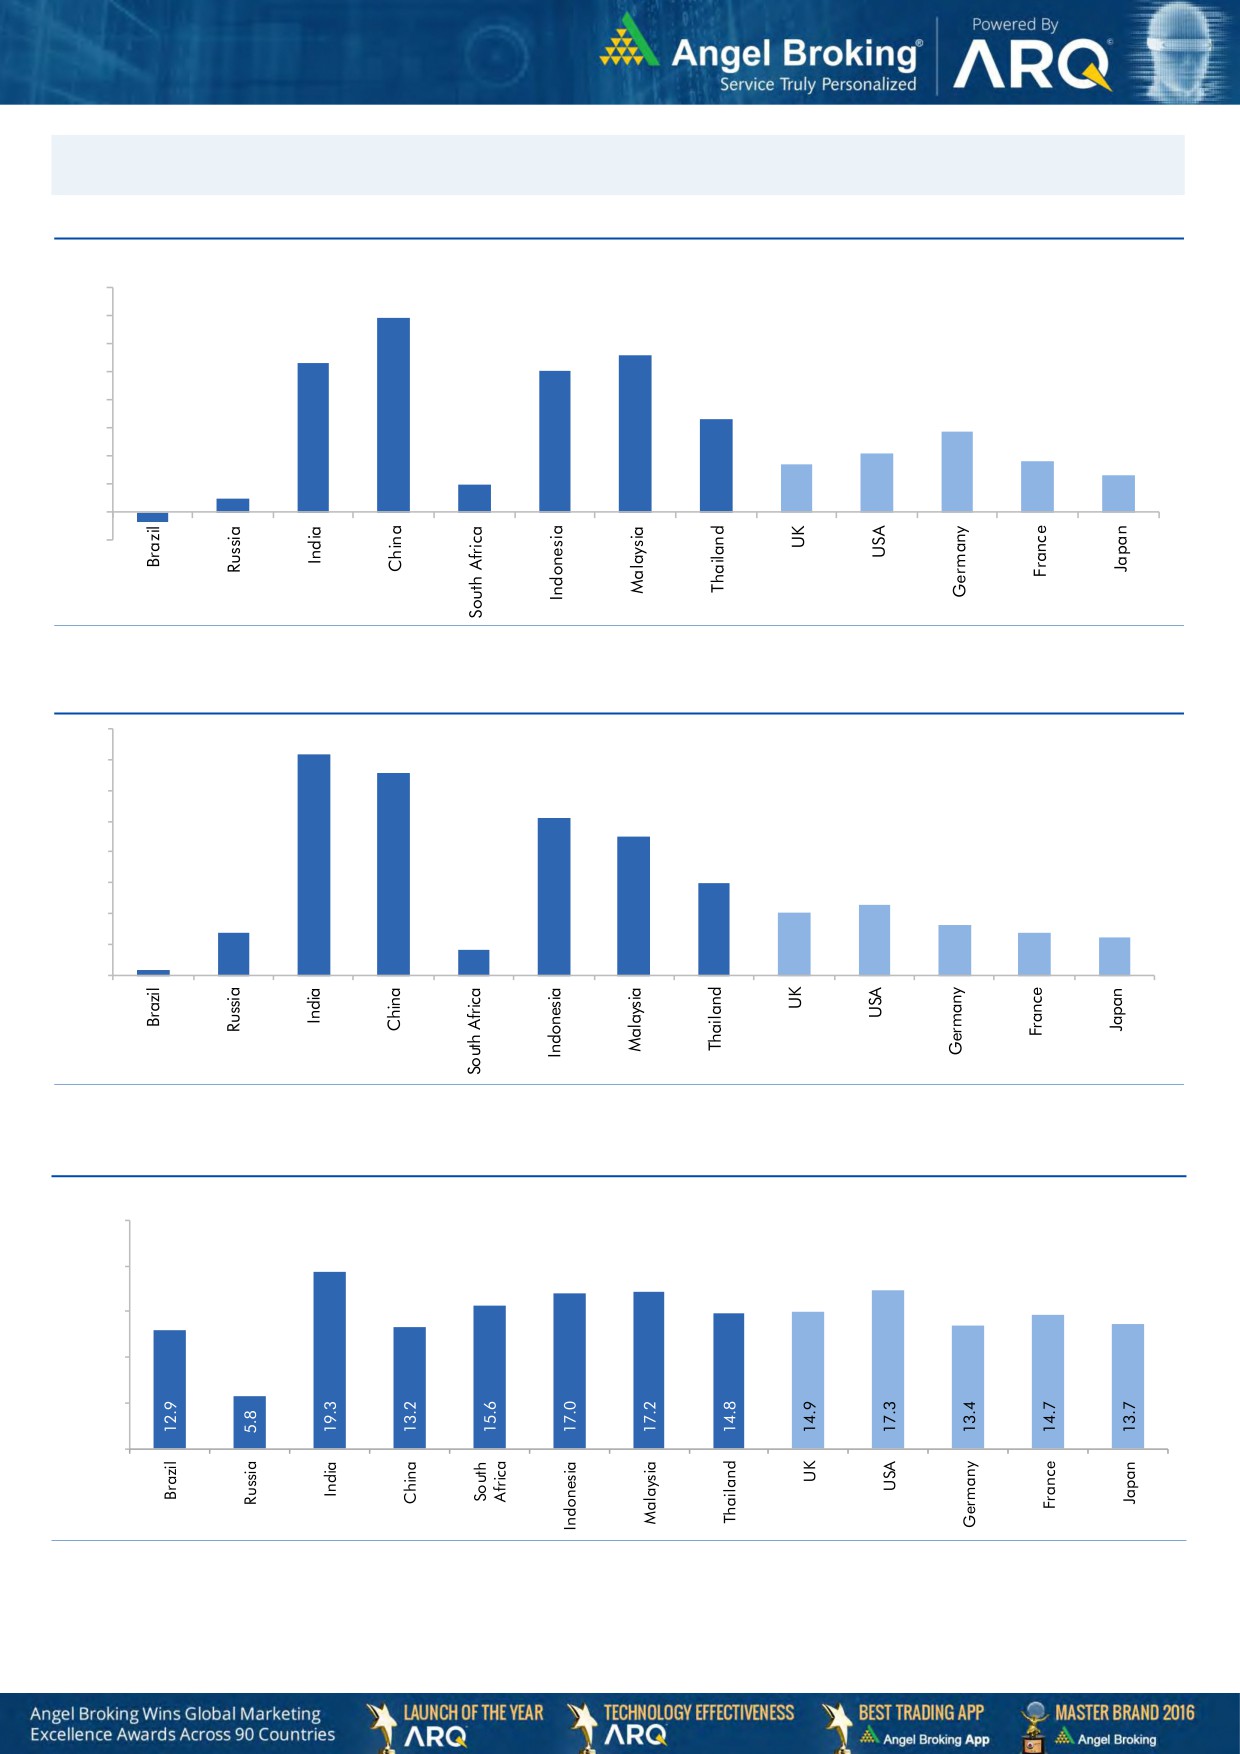
Global watch
Exhibit 1: Latest quarterly GDP Growth (%, yoy) across select developing and developed countries
(%)
8.0
6.9
7.0
5.6
6.0
5.3
5.0
1.0
5.0
4.0
3.3
2.9
3.0
2.1
1.7
1.8
0.5
2.0
1.3
1.0
-
(1.0)
(0.4)
Source: Bloomberg, Angel Research
Exhibit 2: 2016 GDP Growth projection by IMF (%, yoy) across select developing and developed countries
(%)
7.2
7.0
6.6
6.0
5.1
5.0
4.5
4.0
3.0
3.0
2.3
2.0
1.4
1.6
2.0
1.4
1.2
0.2
0.8
1.0
-
Source: IMF, Angel Research
Exhibit 3: One year forward P-E ratio across select developing and developed countries
(x)
25.0
20.0
15.0
10.0
5.0
-
Source: IMF, Angel Research
Market Outlook
August 04, 2017
Exhibit 4: Relative performance of indices across globe
Returns (%)
Country
Name of index
Closing price
1M
3M
1YR
Brazil
Bovespa
66,777
5.6
3.0
17.7
Russia
Micex
1,965
2.5
(3.0)
1.1
India
Nifty
10,014
4.2
7.0
15.9
China
Shanghai Composite
3,273
2.0
4.6
8.5
South Africa
Top 40
49,244
7.5
5.3
6.7
Mexico
Mexbol
51,293
2.5
3.7
9.3
Indonesia
LQ45
962
(1.9)
2.4
6.9
Malaysia
KLCI
1,772
0.6
0.2
6.5
Thailand
SET 50
1,003
0.8
1.0
3.7
USA
Dow Jones
22,026
2.5
5.1
20.0
UK
FTSE
7,475
1.6
3.1
10.0
Japan
Nikkei
20,029
(0.1)
3.7
20.2
Germany
DAX
12,155
(2.3)
(3.9)
13.7
France
CAC
5,130
(0.9)
(5.6)
13.9
Source: Bloomberg, Angel Research
Stock Watch
August 04, 2017
Company Name
Reco
CMP
Target
Mkt Cap
Sales ( Čcr )
OPM(%)
EPS (Č)
PER(x)
P/BV(x)
RoE(%)
EV/Sales(x)
(Č)
Price ( Č)
( Č cr )
FY17E FY18E
FY17E
FY18E
FY17E
FY18E
FY17E
FY18E
FY17E
FY18E
FY17E
FY18E
FY17E
FY18E
Agri / Agri Chemical
Rallis
Reduce
243
209
4,733
1,937
2,164
13.3
14.3
9.0
11.0
27.0
22.1
4.7
4.1
18.4
19.8
2.5
2.2
United Phosphorus
Neutral
882
-
44,793
15,176
17,604
18.5
18.5
37.4
44.6
23.6
19.8
4.6
3.8
21.4
21.2
3.1
2.6
Auto & Auto Ancillary
Ashok Leyland
Accumulate
109
116
31,855
20,019
22,789
11.1
11.7
4.3
5.5
25.3
19.9
4.9
4.4
19.4
22.0
1.5
1.3
Bajaj Auto
Neutral
2,835
-
82,028
25,093
27,891
19.5
19.2
143.9
162.5
19.7
17.5
5.5
4.8
30.3
29.4
3.0
2.6
Bharat Forge
Neutral
1,164
-
27,102
7,726
8,713
20.5
21.2
35.3
42.7
33.0
27.3
6.1
5.5
18.9
20.1
3.6
3.1
Eicher Motors
Neutral
30,726
-
83,643
16,583
20,447
17.5
18.0
598.0
745.2
51.4
41.2
17.6
13.4
41.2
38.3
4.9
3.9
Gabriel India
Neutral
164
-
2,356
1,544
1,715
9.0
9.3
5.4
6.3
30.4
26.0
5.7
5.1
18.9
19.5
1.5
1.3
Hero Motocorp
Neutral
3,839
-
76,667
28,120
30,753
15.2
15.6
169.1
189.2
22.7
20.3
7.8
6.6
30.8
28.2
2.6
2.3
Jamna Auto Industries Neutral
265
-
2,113
1,486
1,620
9.8
9.9
15.0
17.2
17.7
15.4
3.9
3.3
21.8
21.3
1.5
1.4
L G Balakrishnan & Bros Neutral
752
-
1,180
1,302
1,432
11.6
11.9
43.7
53.0
17.2
14.2
2.4
2.2
13.8
14.2
1.0
0.9
Mahindra and Mahindra Neutral
1,417
-
87,999
46,534
53,077
11.6
11.7
67.3
78.1
21.1
18.2
3.4
3.0
15.4
15.8
1.9
1.6
Maruti
Accumulate
7,739
8,495
233,780
67,822
83,717
15.2
15.0
243.0
291.5
31.9
26.6
7.3
5.9
22.9
22.4
3.1
2.5
Minda Industries
Neutral
778
-
6,727
2,728
3,042
9.0
9.1
68.2
86.2
11.4
9.0
2.6
2.1
23.8
24.3
2.5
2.2
Motherson Sumi
Neutral
331
-
69,692
45,896
53,687
7.8
8.3
13.0
16.1
25.4
20.6
8.2
6.5
34.7
35.4
1.6
1.3
Rane Brake Lining
Neutral
1,274
-
1,008
511
562
11.3
11.5
28.1
30.9
45.3
41.2
6.9
6.3
15.3
15.0
2.1
1.9
Setco Automotive
Neutral
39
-
514
741
837
13.0
13.0
15.2
17.0
2.5
2.3
0.4
0.4
15.8
16.3
1.1
1.0
Tata Motors
Neutral
432
-
124,690
300,209
338,549
8.9
8.4
42.7
54.3
10.1
8.0
1.6
1.4
15.6
17.2
0.5
0.5
TVS Motor
Neutral
587
-
27,869
13,390
15,948
6.9
7.1
12.8
16.5
46.0
35.5
11.4
9.1
26.3
27.2
2.1
1.8
Amara Raja Batteries
Buy
820
962
14,008
5,339
6,220
15.9
15.3
28.0
32.3
29.3
25.4
5.6
4.7
19.1
18.5
2.6
2.3
Exide Industries
Neutral
222
-
18,828
7,439
8,307
15.0
15.0
8.1
9.3
27.4
23.8
3.8
3.4
14.3
16.7
2.1
1.9
Apollo Tyres
Neutral
271
-
13,789
12,877
14,504
14.3
13.9
21.4
23.0
12.6
11.8
2.0
1.7
16.4
15.2
1.2
1.1
Ceat
Neutral
1,902
-
7,695
7,524
8,624
13.0
12.7
131.1
144.3
14.5
13.2
2.7
2.3
19.8
18.6
1.1
1.0
JK Tyres
Neutral
164
-
3,714
7,455
8,056
15.0
15.0
21.8
24.5
7.5
6.7
1.6
1.3
22.8
21.3
0.6
0.5
Swaraj Engines
Neutral
2,075
-
2,578
660
810
15.2
16.4
54.5
72.8
38.1
28.5
11.9
10.8
31.5
39.2
3.7
3.0
Subros
Neutral
236
-
1,417
1,488
1,681
11.7
11.9
6.4
7.2
36.9
33.0
3.9
3.5
10.8
11.4
1.2
1.0
Indag Rubber
Neutral
191
-
501
286
326
19.8
16.8
11.7
13.3
16.3
14.3
2.8
2.6
17.8
17.1
1.4
1.2
Capital Goods
ACE
Neutral
69
-
678
709
814
4.1
4.6
1.4
2.1
48.9
32.6
2.0
1.9
4.4
6.0
1.1
1.0
BEML
Neutral
1,689
-
7,034
3,451
4,055
6.3
9.2
31.4
57.9
53.8
29.2
3.2
2.9
6.3
10.9
2.2
1.8
Bharat Electronics
Neutral
181
-
40,339
8,137
9,169
16.8
17.2
58.7
62.5
3.1
2.9
0.5
0.4
44.6
46.3
3.9
3.5
Stock Watch
August 04, 2017
Company Name
Reco
CMP
Target
Mkt Cap
Sales ( Čcr )
OPM(%)
EPS (Č)
PER(x)
P/BV(x)
RoE(%)
EV/Sales(x)
(Č)
Price ( Č)
( Č cr )
FY17E
FY18E
FY17E
FY18E
FY17E
FY18E
FY17E
FY18E
FY17E
FY18E
FY17E
FY18E
FY17E
FY18E
Capital Goods
Voltas
Neutral
537
-
17,762
6,511
7,514
7.9
8.7
12.9
16.3
41.6
32.9
7.5
6.6
16.7
18.5
2.5
2.1
BGR Energy
Neutral
144
-
1,038
16,567
33,848
6.0
5.6
7.8
5.9
18.5
24.4
1.1
1.0
4.7
4.2
0.2
0.1
BHEL
Neutral
139
-
33,924
28,797
34,742
-
2.8
2.3
6.9
60.3
20.1
1.0
1.0
1.3
4.8
0.8
0.6
Blue Star
Accumulate
677
760
6,485
4,283
5,077
5.9
7.3
14.9
22.1
45.5
30.6
8.8
7.4
20.4
26.4
1.6
1.3
CG Power and Industrial
Neutral
82
-
5,117
5,777
6,120
5.9
7.0
3.3
4.5
24.7
18.1
1.1
1.0
4.4
5.9
0.8
0.7
Solutions
Greaves Cotton
Neutral
159
-
3,879
1,755
1,881
16.8
16.9
7.8
8.5
20.4
18.7
4.1
3.8
20.6
20.9
1.9
1.7
Inox Wind
Neutral
136
-
3,007
5,605
6,267
15.7
16.4
24.8
30.0
5.5
4.5
1.5
1.1
25.9
24.4
0.6
0.5
KEC International
Neutral
304
-
7,805
9,294
10,186
7.9
8.1
9.9
11.9
30.7
25.5
4.5
3.9
15.6
16.3
1.1
1.0
KEI Industries
Accumulate
226
258
1,759
2,633
3,001
10.4
10.0
12.7
13.0
17.8
17.4
3.8
3.2
21.4
18.2
0.9
0.8
Thermax
Neutral
902
-
10,752
5,421
5,940
7.3
7.3
25.7
30.2
35.1
29.9
4.2
3.9
12.2
13.1
1.9
1.7
VATech Wabag
Accumulate
623
681
3,398
3,136
3,845
8.9
9.1
26.0
35.9
24.0
17.3
3.0
2.6
13.4
15.9
1.0
0.8
Cement
ACC
Neutral
1,810
-
33,989
11,225
13,172
13.2
16.9
44.5
75.5
40.7
24.0
3.9
3.6
11.2
14.2
3.0
2.6
Ambuja Cements
Neutral
272
-
54,019
9,350
10,979
18.2
22.5
5.8
9.5
46.9
28.6
3.9
3.5
10.2
12.5
5.8
4.9
India Cements
Neutral
193
-
5,940
4,364
4,997
18.5
19.2
7.9
11.3
24.4
17.1
1.8
1.7
8.0
8.5
2.1
1.9
JK Cement
Neutral
1,011
-
7,065
4,398
5,173
15.5
17.5
31.2
55.5
32.4
18.2
3.9
3.4
12.0
15.5
2.2
1.8
J K Lakshmi Cement
Neutral
453
-
5,332
2,913
3,412
14.5
19.5
7.5
22.5
60.4
20.1
3.7
3.1
12.5
18.0
2.4
2.0
Orient Cement
Neutral
154
-
3,159
2,114
2,558
18.5
20.5
8.1
11.3
19.0
13.7
2.8
2.4
9.0
14.0
2.1
1.7
UltraTech Cement
Neutral
4,085
-
112,131
25,768
30,385
21.0
23.5
111.0
160.0
36.8
25.5
4.7
4.1
13.5
15.8
4.4
3.7
Construction
ITNL
Neutral
90
-
2,952
8,946
10,017
31.0
31.6
8.1
9.1
11.1
9.9
0.4
0.4
4.2
5.0
3.7
3.4
KNR Constructions
Neutral
209
-
2,939
1,385
1,673
14.7
14.0
41.2
48.5
5.1
4.3
1.0
0.8
14.9
15.2
2.2
1.8
Larsen & Toubro
Buy
1,174
1,700
164,444
111,017
124,908
11.0
11.0
61.1
66.7
19.2
17.6
2.3
2.1
13.1
12.9
2.5
2.3
Gujarat Pipavav Port
Neutral
141
-
6,836
705
788
52.2
51.7
5.0
5.6
28.3
25.3
2.8
2.5
11.2
11.2
9.3
7.9
Nagarjuna Const.
Neutral
88
-
4,889
8,842
9,775
9.1
8.8
5.3
6.4
16.6
13.7
1.3
1.2
8.2
9.1
0.7
0.6
PNC Infratech
Neutral
140
-
3,602
2,350
2,904
13.1
13.2
9.0
8.8
15.6
16.0
0.6
0.5
15.9
13.9
1.7
1.3
Simplex Infra
Neutral
463
-
2,290
6,829
7,954
10.5
10.5
31.4
37.4
14.7
12.4
1.5
1.4
9.9
13.4
0.8
0.6
Power Mech Projects
Neutral
585
-
861
1,801
2,219
12.7
14.6
72.1
113.9
8.1
5.1
1.5
1.3
16.8
11.9
0.5
0.4
Sadbhav Engineering
Neutral
289
-
4,954
3,598
4,140
10.3
10.6
9.0
11.9
32.1
24.3
3.4
3.0
9.9
11.9
1.7
1.4
NBCC
Neutral
217
-
19,539
7,428
9,549
7.9
8.6
8.2
11.0
26.5
19.7
1.3
1.0
28.2
28.7
2.3
1.8
MEP Infra
Neutral
111
-
1,810
1,877
1,943
30.6
29.8
3.0
4.2
37.1
26.5
18.0
12.1
0.6
0.6
2.3
2.2
Stock Watch
August 04, 2017
Company Name
Reco
CMP
Target
Mkt Cap
Sales ( Čcr )
OPM(%)
EPS (Č)
PER(x)
P/BV(x)
RoE(%)
EV/Sales(x)
(Č)
Price ( Č)
( Č cr )
FY17E
FY18E
FY17E
FY18E
FY17E
FY18E
FY17E
FY18E
FY17E
FY18E
FY17E
FY18E
FY17E
FY18E
Construction
SIPL
Neutral
103
-
3,630
1,036
1,252
65.5
66.2
(8.4)
(5.6)
3.9
4.4
(22.8)
(15.9)
11.7
9.7
Engineers India
Neutral
160
-
10,762
1,725
1,935
16.0
19.1
11.4
13.9
14.0
11.5
1.9
1.9
13.4
15.3
5.2
4.6
Financials
Axis Bank
Accumulate
506
580
121,298
46,932
53,575
3.5
3.4
32.4
44.6
15.6
11.3
2.0
1.8
13.6
16.5
-
-
Bank of Baroda
Neutral
158
-
36,417
19,980
23,178
1.8
1.8
11.5
17.3
13.7
9.1
1.6
1.3
8.3
10.1
-
-
Canara Bank
Neutral
348
-
20,771
15,225
16,836
1.8
1.8
14.5
28.0
24.0
12.4
1.7
1.3
5.8
8.5
-
-
Can Fin Homes
Neutral
2,992
-
7,965
420
526
3.5
3.5
86.5
107.8
34.6
27.8
7.4
6.1
23.6
24.1
-
-
Cholamandalam Inv. &
Accumulate
1,162
1,230
18,154
2,012
2,317
6.3
6.3
42.7
53.6
27.2
21.7
4.3
3.7
16.9
18.3
-
-
Fin. Co.
Dewan Housing Finance Buy
451
550
14,136
2,225
2,688
2.9
2.9
29.7
34.6
15.2
13.0
2.5
1.6
16.1
14.8
-
-
Equitas Holdings
Buy
162
235
5,469
939
1,281
11.7
11.5
5.8
8.2
27.9
19.7
2.4
2.1
10.9
11.5
-
-
Federal Bank
Accumulate
113
125
22,014
8,259
8,995
3.0
3.0
4.3
5.6
26.4
20.2
2.2
2.1
8.5
10.1
-
-
HDFC
Neutral
1,738
-
276,789
11,475
13,450
3.4
3.4
45.3
52.5
38.4
33.1
7.4
6.5
20.2
20.5
-
-
HDFC Bank
Neutral
1,780
-
458,388
46,097
55,433
4.5
4.5
58.4
68.0
30.5
26.2
5.3
4.5
18.8
18.6
-
-
ICICI Bank
Accumulate
296
335
189,580
42,800
44,686
3.1
3.3
18.0
21.9
16.4
13.5
2.2
2.1
11.1
12.3
-
-
Karur Vysya Bank
Buy
137
160
8,294
5,640
6,030
3.3
3.2
8.9
10.0
15.4
13.7
1.6
1.5
11.2
11.4
-
-
Lakshmi Vilas Bank
Neutral
177
-
3,394
3,339
3,799
2.7
2.8
11.0
14.0
16.1
12.6
1.7
1.5
11.2
12.7
-
-
LIC Housing Finance
Neutral
681
-
34,380
3,712
4,293
2.6
2.5
39.0
46.0
17.5
14.8
3.3
2.8
19.9
20.1
-
-
Punjab Natl.Bank
Neutral
149
-
31,792
23,532
23,595
2.3
2.4
6.8
12.6
22.0
11.9
3.4
2.4
3.3
6.5
-
-
RBL Bank
Neutral
517
-
19,623
1,783
2,309
2.6
2.6
12.7
16.4
40.7
31.6
4.4
4.0
12.8
13.3
-
-
Repco Home Finance
Accumulate
734
825
4,595
388
457
4.5
4.2
30.0
38.0
24.5
19.3
4.1
3.4
18.0
19.2
-
-
South Ind.Bank
Neutral
29
-
5,221
6,435
7,578
2.5
2.5
2.7
3.1
10.7
9.3
1.4
1.2
10.1
11.2
-
-
St Bk of India
Neutral
301
-
259,609
88,650
98,335
2.6
2.6
13.5
18.8
22.3
16.0
2.1
1.9
7.0
8.5
-
-
Union Bank
Neutral
144
-
9,882
13,450
14,925
2.3
2.3
25.5
34.5
5.6
4.2
0.8
0.7
7.5
10.2
-
-
Yes Bank
Neutral
1,785
-
81,699
8,978
11,281
3.3
3.4
74.0
90.0
24.1
19.8
4.6
3.9
17.0
17.2
-
-
FMCG
Akzo Nobel India
Neutral
1,755
-
8,416
2,955
3,309
13.3
13.7
57.2
69.3
30.7
25.3
10.0
8.4
32.7
33.3
2.6
2.3
Asian Paints
Neutral
1,146
-
109,962
17,128
18,978
16.8
16.4
19.1
20.7
60.0
55.4
20.9
19.7
34.8
35.5
6.3
5.7
Britannia
Neutral
3,871
-
46,476
9,594
11,011
14.6
14.9
80.3
94.0
48.2
41.2
19.8
15.3
41.2
-
4.7
4.1
Colgate
Neutral
1,083
-
29,455
4,605
5,149
23.4
23.4
23.8
26.9
45.5
40.3
25.2
19.7
64.8
66.8
6.3
5.6
Dabur India
Neutral
306
-
53,841
8,315
9,405
19.8
20.7
8.1
9.2
37.7
33.2
10.5
8.7
31.6
31.0
6.1
5.4
GlaxoSmith Con*
Neutral
5,403
-
22,722
4,350
4,823
21.2
21.4
179.2
196.5
30.2
27.5
8.0
6.8
27.1
26.8
4.6
4.1
Stock Watch
August 04, 2017
Company Name
Reco
CMP
Target
Mkt Cap
Sales ( Čcr )
OPM(%)
EPS (Č)
PER(x)
P/BV(x)
RoE(%)
EV/Sales(x)
(Č)
Price ( Č)
( Č cr )
FY17E FY18E
FY17E
FY18E
FY17E
FY18E
FY17E
FY18E
FY17E
FY18E
FY17E
FY18E
FY17E
FY18E
FMCG
Godrej Consumer
Neutral
970
-
66,060
10,235
11,428
18.4
18.6
41.1
44.2
23.6
21.9
5.2
4.4
24.9
24.8
6.5
5.8
HUL
Neutral
1,170
-
253,156
35,252
38,495
17.8
17.8
20.7
22.4
56.7
52.3
54.1
46.4
95.6
88.9
7.0
6.4
ITC
Neutral
281
-
342,234
40,059
44,439
38.3
39.2
9.0
10.1
31.3
27.8
8.7
7.6
27.8
27.5
8.0
7.2
Marico
Neutral
328
-
42,308
6,430
7,349
18.8
19.5
6.4
7.7
51.2
42.6
15.5
13.0
33.2
32.5
6.4
5.5
Nestle*
Neutral
6,735
-
64,937
10,073
11,807
20.7
21.5
124.8
154.2
54.0
43.7
22.2
19.9
34.8
36.7
6.3
5.3
Tata Global
Neutral
167
-
10,518
8,675
9,088
9.8
9.8
7.4
8.2
22.5
20.3
1.8
1.7
7.9
8.1
1.1
1.1
Procter & Gamble
Neutral
8,015
-
26,018
2,939
3,342
23.2
23.0
146.2
163.7
54.8
49.0
13.9
11.5
25.3
23.5
8.4
7.3
Hygiene
IT
HCL Tech^
Buy
876
1,014
124,997
46,723
52,342
22.1
20.9
60.0
62.8
14.6
14.0
3.7
3.1
25.3
22.4
2.4
2.1
Infosys
Buy
984
1,179
225,928
68,484
73,963
26.0
26.0
63.0
64.0
15.6
15.4
3.3
3.0
20.8
19.7
3.0
2.6
TCS
Accumulate
2,490
2,651
490,548
117,966
127,403
27.5
27.6
134.3
144.5
18.5
17.2
5.5
5.1
29.8
29.7
3.8
3.5
Tech Mahindra
Buy
407
533
39,721
29,141
31,051
14.4
15.0
32.3
35.6
12.6
11.4
2.2
1.9
17.1
17.0
1.2
1.1
Wipro
Neutral
290
-
140,956
55,421
58,536
20.3
20.3
35.1
36.5
8.3
7.9
1.4
1.2
19.2
14.6
2.0
1.7
Media
D B Corp
Neutral
380
-
6,982
2,297
2,590
27.4
28.2
21.0
23.4
18.1
16.2
4.2
3.7
23.7
23.1
2.8
2.4
HT Media
Neutral
87
-
2,019
2,693
2,991
12.6
12.9
7.9
9.0
11.0
9.6
0.9
0.9
7.8
8.3
0.3
0.2
Jagran Prakashan
Buy
177
225
5,785
2,283
2,555
28.0
28.0
10.6
12.3
16.6
14.5
3.6
3.1
21.4
21.4
2.5
2.2
Sun TV Network
Neutral
797
-
31,426
2,850
3,265
70.1
71.0
26.2
30.4
30.4
26.2
7.8
6.9
24.3
25.6
10.6
9.1
Hindustan Media
Neutral
274
-
2,014
1,016
1,138
24.3
25.2
27.3
30.1
10.1
9.1
1.9
1.7
16.2
15.8
1.3
1.1
Ventures
TV Today Network
Buy
241
344
1,437
608
667
21.5
22.3
15.7
19.2
15.4
12.5
2.3
2.0
16.1
16.0
2.0
1.7
Music Broadcast Limited Buy
352
434
2,009
271
317
91.0
109.0
6.0
10.0
58.7
35.2
3.7
3.3
6.5
9.3
7.0
5.8
Metals & Mining
Coal India
Neutral
242
-
150,126
84,638
94,297
21.4
22.3
24.5
27.1
9.9
8.9
4.1
3.9
42.6
46.0
1.3
1.2
Hind. Zinc
Neutral
282
-
119,239
14,252
18,465
55.9
48.3
15.8
21.5
17.9
13.1
2.9
2.5
17.0
20.7
8.4
6.5
Hindalco
Neutral
221
-
49,570
107,899
112,095
7.4
8.2
9.2
13.0
24.0
17.0
1.2
1.1
4.8
6.6
1.0
0.9
JSW Steel
Neutral
224
-
54,134
53,201
58,779
16.1
16.2
130.6
153.7
1.7
1.5
0.2
0.2
14.0
14.4
1.8
1.6
NMDC
Neutral
121
-
38,362
6,643
7,284
44.4
47.7
7.1
7.7
17.1
15.8
1.5
1.4
8.8
9.2
3.5
3.2
SAIL
Neutral
61
-
25,049
47,528
53,738
(0.7)
2.1
(1.9)
2.6
23.3
0.7
0.6
(1.6)
3.9
1.4
1.2
Vedanta
Neutral
280
-
104,063
71,744
81,944
19.2
21.7
13.4
20.1
20.9
13.9
1.8
1.6
8.4
11.3
1.8
1.5
Tata Steel
Neutral
560
-
54,344
121,374
121,856
7.2
8.4
18.6
34.3
30.1
16.3
1.9
1.7
6.1
10.1
1.1
1.1
Oil & Gas
GAIL
Neutral
370
-
62,544
56,220
65,198
9.3
10.1
27.1
33.3
13.7
11.1
1.3
1.2
9.3
10.7
1.3
1.1
ONGC
Neutral
166
-
212,903
137,222
152,563
15.0
21.8
19.5
24.1
8.5
6.9
0.7
0.7
8.5
10.1
1.8
1.6
Stock Watch
August 04, 2017
Company Name
Reco
CMP
Target
Mkt Cap
Sales ( Čcr )
OPM(%)
EPS (Č)
PER(x)
P/BV(x)
RoE(%)
EV/Sales(x)
(Č)
Price ( Č)
( Č cr )
FY17E FY18E
FY17E
FY18E
FY17E
FY18E
FY17E
FY18E
FY17E
FY18E
FY17E
FY18E
FY17E
FY18E
Oil & Gas
Indian Oil Corp
Neutral
387
-
187,948
373,359
428,656
5.9
5.5
54.0
59.3
7.2
6.5
1.1
1.0
16.0
15.6
0.7
0.6
Reliance Industries
Neutral
1,652
-
537,040
301,963
358,039
12.1
12.6
87.7
101.7
18.8
16.2
1.9
1.8
10.7
11.3
2.3
1.9
Pharmaceuticals
Alembic Pharma
Accumulate
529
600
9,964
3,101
3,966
19.7
20.5
21.4
25.5
24.7
20.7
5.2
4.3
23.0
22.8
3.2
2.3
Alkem Laboratories Ltd
Buy
1,805
2,161
21,583
5,853
6,901
17.1
18.4
74.6
85.0
24.2
21.2
5.1
4.3
21.1
20.2
3.7
3.1
Aurobindo Pharma
Accumulate
741
823
43,434
14,845
17,086
21.5
22.1
39.4
44.7
18.8
16.6
4.6
3.7
27.6
24.7
3.1
2.7
Aventis*
Neutral
4,216
-
9,709
2,206
2,508
16.6
16.8
128.9
139.9
32.7
30.1
5.6
4.4
21.6
23.5
4.2
3.5
Cadila Healthcare
Sell
546
450
55,907
9,220
11,584
18.4
20.3
14.5
18.7
37.7
29.2
8.0
6.5
23.5
24.6
6.4
4.9
Cipla
Sell
557
461
44,812
14,281
16,619
15.4
16.2
12.5
19.7
44.6
28.3
3.6
3.2
8.4
12.0
3.3
2.8
Dr Reddy's
Neutral
2,332
-
38,652
14,081
15,937
16.1
18.6
72.6
105.9
32.1
22.0
3.2
2.8
9.6
13.6
3.0
2.6
Dishman Pharma
Sell
143
1,718
1,890
22.7
22.8
9.5
11.3
10.1
10.9
3.3
2.9
GSK Pharma*
Neutral
2,348
-
19,890
2,927
3,290
11.8
16.2
34.4
49.6
68.3
47.3
9.9
10.3
13.9
21.3
6.6
5.9
Indoco Remedies
Sell
200
153
1,839
1,067
1,154
12.1
14.9
8.4
11.3
23.8
17.7
2.8
2.5
12.6
15.0
1.9
1.8
Ipca labs
Buy
467
620
5,887
3,211
3,593
13.9
14.5
15.4
19.4
30.3
24.1
2.4
2.2
8.2
9.5
2.0
1.7
Lupin
Buy
995
1,526
44,944
17,120
18,657
24.1
24.1
56.9
61.1
17.5
16.3
3.3
2.8
20.7
18.6
2.9
2.3
Natco Pharma
Accumulate
969
1,060
16,884
2,065
1,988
33.1
33.7
27.9
25.7
34.7
37.7
10.1
8.6
29.2
22.9
8.3
8.4
Sun Pharma
Buy
516
712
123,849
30,264
32,899
29.0
26.9
32.7
31.6
15.8
16.3
3.4
2.9
22.2
18.7
3.8
3.4
Power
Tata Power
Neutral
83
-
22,355
36,916
39,557
17.4
27.1
5.1
6.3
16.2
13.1
1.4
1.3
9.0
10.3
1.6
1.5
NTPC
Neutral
172
-
142,193
86,605
95,545
17.5
20.8
11.8
13.4
14.6
12.9
1.5
1.4
10.5
11.1
3.0
3.0
Power Grid
Neutral
222
-
116,089
25,315
29,193
88.2
88.7
14.2
17.2
15.7
12.9
2.4
2.1
15.2
16.1
9.2
8.3
Real Estate
Prestige Estate
Neutral
272
-
10,206
4,707
5,105
25.2
26.0
10.3
13.0
26.4
20.9
2.1
2.0
10.3
10.2
3.3
3.0
MLIFE
Buy
423
522
2,169
1,152
1,300
22.7
24.6
29.9
35.8
14.1
11.8
1.0
1.0
7.6
8.6
2.6
2.2
Telecom
Bharti Airtel
Neutral
424
-
169,590
105,086
114,808
34.5
34.7
12.2
16.4
34.8
25.9
2.4
2.2
6.8
8.4
2.5
2.2
Idea Cellular
Neutral
93
-
33,650
40,133
43,731
37.2
37.1
6.4
6.5
14.6
14.4
1.2
1.1
8.2
7.6
1.9
1.6
zOthers
Abbott India
Neutral
4,372
-
9,290
3,153
3,583
14.1
14.4
152.2
182.7
28.7
23.9
141.0
120.4
25.6
26.1
2.7
2.3
Asian Granito
Buy
408
480
1,226
1,066
1,169
11.6
12.5
13.0
16.0
31.4
25.5
3.1
2.7
9.5
10.7
1.5
1.3
Bajaj Electricals
Buy
328
395
3,323
4,801
5,351
5.7
6.2
10.4
13.7
31.5
24.0
3.9
3.5
12.4
14.5
0.7
0.6
Banco Products (India)
Neutral
215
-
1,536
1,353
1,471
12.3
12.4
14.5
16.3
14.8
13.2
20.5
18.4
14.5
14.6
1.1
115.5
Coffee Day Enterprises
Neutral
242
-
4,991
2,964
3,260
20.5
21.2
4.7
8.0
-
30.3
2.8
2.6
5.5
8.5
2.1
1.9
Ltd
Competent Automobiles Neutral
219
-
140
1,137
1,256
3.1
2.7
28.0
23.6
7.8
9.3
42.1
38.0
14.3
11.5
0.1
0.1
Stock Watch
August 04, 2017
Company Name
Reco
CMP
Target
Mkt Cap
Sales ( Čcr )
OPM(%)
EPS (Č)
PER(x)
P/BV(x)
RoE(%)
EV/Sales(x)
(Č)
Price ( Č)
( Č cr )
FY17E
FY18E
FY17E
FY18E
FY17E
FY18E
FY17E
FY18E
FY17E
FY18E
FY17E
FY18E
FY17E
FY18E
zOthers
Elecon Engineering
Neutral
54
-
606
1,482
1,660
13.7
14.5
3.9
5.8
13.9
9.3
3.3
3.0
7.8
10.9
0.7
0.6
Finolex Cables
Neutral
476
-
7,277
2,883
3,115
12.0
12.1
14.2
18.6
33.5
25.6
17.8
15.6
15.8
14.6
2.2
2.0
Garware Wall Ropes
Neutral
892
-
1,951
863
928
15.1
15.2
36.4
39.4
24.5
22.6
4.4
3.8
17.5
15.9
2.2
2.0
Goodyear India*
Neutral
896
-
2,066
1,598
1,704
10.4
10.2
49.4
52.6
18.1
17.0
83.7
73.4
18.2
17.0
1.0
139.7
Hitachi
Neutral
2,020
-
5,492
2,081
2,433
8.8
8.9
33.4
39.9
60.5
50.6
48.8
40.7
22.1
21.4
2.6
2.2
HSIL
Neutral
359
-
2,592
2,384
2,515
15.8
16.3
15.3
19.4
23.4
18.5
23.3
20.0
7.8
9.3
1.3
1.2
Interglobe Aviation
Neutral
1,272
-
46,010
21,122
26,005
14.5
27.6
110.7
132.1
11.5
9.6
68.8
49.1
168.5
201.1
2.2
1.7
Jyothy Laboratories
Neutral
390
-
7,086
1,440
2,052
11.5
13.0
8.5
10.0
45.9
39.0
11.1
10.3
18.6
19.3
5.2
3.6
Kirloskar Engines India
Neutral
400
-
5,785
2,554
2,800
9.9
10.0
10.5
12.1
38.1
33.1
15.9
15.0
10.7
11.7
1.9
1.7
Ltd
Linc Pen & Plastics
Neutral
263
-
389
382
420
9.3
9.5
13.5
15.7
19.5
16.7
3.3
2.9
17.1
17.3
1.1
1.0
M M Forgings
Neutral
605
-
730
546
608
20.4
20.7
41.3
48.7
14.7
12.4
82.8
73.3
16.6
17.0
1.2
1.1
Manpasand Bever.
Neutral
788
-
4,510
836
1,087
19.6
19.4
16.9
23.8
46.7
33.1
5.6
4.9
12.0
14.8
5.1
3.9
Mirza International
Neutral
174
-
2,088
963
1,069
17.2
18.0
6.1
7.5
28.3
23.1
4.3
3.7
15.0
15.7
2.4
2.1
MT Educare
Neutral
67
-
269
366
417
17.7
18.2
9.4
10.8
7.2
6.2
1.6
1.4
22.2
22.3
0.6
0.5
Narayana Hrudaya
Neutral
299
-
6,111
1,873
2,166
11.5
11.7
2.6
4.0
113.1
75.4
6.9
6.3
6.1
8.3
3.4
2.9
Navkar Corporation
Buy
197
265
2,812
347
371
43.2
37.3
6.7
6.0
29.6
32.9
2.0
1.8
6.2
10.6
9.2
8.6
Navneet Education
Neutral
163
-
3,803
1,062
1,147
24.0
24.0
6.1
6.6
26.7
24.6
5.5
4.9
20.6
19.8
3.7
3.4
Nilkamal
Neutral
1,810
-
2,701
1,995
2,165
10.7
10.4
69.8
80.6
25.9
22.5
103.4
89.9
16.6
16.5
1.3
1.2
Page Industries
Neutral
16,364
-
18,252
2,450
3,124
20.1
17.6
299.0
310.0
54.7
52.8
364.5
278.2
47.1
87.5
7.5
5.9
Parag Milk Foods
Neutral
253
-
2,127
1,919
2,231
9.3
9.6
9.5
12.9
26.8
19.6
4.2
3.4
15.5
17.5
1.3
1.1
Quick Heal
Neutral
208
-
1,460
408
495
27.3
27.0
7.7
8.8
26.9
23.7
2.5
2.5
9.3
10.6
2.7
2.3
Radico Khaitan
Neutral
145
-
1,933
1,667
1,824
13.0
13.2
6.7
8.2
21.9
17.8
2.0
1.8
9.0
10.2
1.5
1.4
Relaxo Footwears
Neutral
459
-
5,513
2,085
2,469
9.2
8.2
7.6
8.0
60.7
57.7
23.5
20.1
17.9
18.8
2.7
2.3
S H Kelkar & Co.
Neutral
266
-
3,846
1,036
1,160
15.1
15.0
6.1
7.2
43.6
37.1
4.7
4.3
10.7
11.5
3.6
3.2
Siyaram Silk Mills
Buy
2,097
2,500
1,966
1,574
1,769
12.5
12.7
97.1
113.1
21.6
18.5
3.3
2.9
15.4
15.5
1.5
1.3
Styrolution ABS India*
Neutral
1,026
-
1,805
1,440
1,537
9.2
9.0
40.6
42.6
25.3
24.1
64.5
58.7
12.3
11.6
1.2
1.1
Surya Roshni
Neutral
285
-
1,249
3,342
3,625
7.8
7.5
17.3
19.8
16.5
14.4
31.3
25.1
10.5
10.8
0.6
0.6
Team Lease Serv.
Neutral
1,438
-
2,458
3,229
4,001
1.5
1.8
22.8
32.8
63.2
43.8
6.8
5.9
10.7
13.4
0.7
0.5
The Byke Hospitality
Neutral
198
-
795
287
384
20.5
20.5
7.6
10.7
26.1
18.5
5.5
4.4
20.7
23.5
2.8
2.1
Stock Watch
August 04, 2017
Company Name
Reco
CMP
Target Mkt Cap
Sales ( Čcr )
OPM(%)
EPS (Č)
PER(x)
P/BV(x)
RoE(%)
EV/Sales(x)
(Č)
Price ( Č)
( Č cr )
FY17E FY18E FY17E FY18E FY17E FY18E FY17E FY18E FY17E FY18E FY17E FY18E FY17E FY18E
zOthers
Transport Corporation of
Neutral
302
-
2,312
2,671
2,911
8.5
8.8
13.9
15.7
21.8
19.3
3.0
2.7
13.7
13.8
1.0
0.9
India
TVS Srichakra
Neutral
3,651
-
2,796
2,304
2,614
13.7
13.8
231.1
266.6
15.8
13.7
410.3
323.1
33.9
29.3
1.2
1.0
UFO Moviez
Neutral
365
-
1,007
619
685
33.2
33.4
30.0
34.9
12.2
10.5
1.7
1.5
13.8
13.9
1.3
1.0
Visaka Industries
Neutral
490
-
777
1,051
1,138
10.3
10.4
21.0
23.1
23.3
21.2
62.8
58.8
9.0
9.2
1.0
0.9
VRL Logistics
Neutral
327
-
2,987
1,902
2,119
16.7
16.6
14.6
16.8
22.5
19.5
4.9
4.3
21.9
22.2
1.7
1.5
VIP Industries
Buy
186
218
2,628
1,270
1,450
10.4
10.4
5.6
6.5
33.2
28.6
6.9
6.0
20.7
21.1
2.1
1.8
Navin Fluorine
Neutral
728
-
3,588
789
945
21.1
22.4
24.0
28.7
30.3
25.4
4.9
4.2
17.8
18.5
4.5
3.7
Source: Company, Angel Research; Note: *December year end; #September year end; &October year end; Price as on August 03, 2017
Market Outlook
August 04, 2017
Research Team Tel: 022 - 39357800
DISCLAIMER
Angel Broking Private Limited (hereinafter referred to as “Angel”) is a registered Member of National Stock Exchange of India
Limited,Bombay Stock Exchange Limited and Metropolitan Stock Exchange Limited. It is also registered as a Depository Participant with
CDSL and Portfolio Manager with SEBI. It also has registration with AMFI as a Mutual Fund Distributor. Angel Broking Private Limited is a
registered entity with SEBI for Research Analyst in terms of SEBI (Research Analyst) Regulations, 2014 vide registration number
INH000000164. Angel or its associates has not been debarred/ suspended by SEBI or any other regulatory authority for accessing
/dealing in securities Market. Angel or its associates/analyst has not received any compensation / managed or
co-managed public offering of securities of the company covered by Analyst during the past twelve months.
This document is solely for the personal information of the recipient, and must not be singularly used as the basis of any investment
decision. Nothing in this document should be construed as investment or financial advice. Each recipient of this document should make
such investigations as they deem necessary to arrive at an independent evaluation of an investment in the securities of the companies
referred to in this document (including the merits and risks involved), and should consult their own advisors to determine the merits and
risks of such an investment.
Reports based on technical and derivative analysis center on studying charts of a stock's price movement, outstanding positions and
trading volume, as opposed to focusing on a company's fundamentals and, as such, may not match with a report on a company's
fundamentals. Investors are advised to refer the Fundamental and Technical Research Reports available on our website to evaluate the
contrary view, if any.
The information in this document has been printed on the basis of publicly available information, internal data and other reliable
sources believed to be true, but we do not represent that it is accurate or complete and it should not be relied on as such, as this
document is for general guidance only. Angel Broking Pvt. Limited or any of its affiliates/ group companies shall not be in any way
responsible for any loss or damage that may arise to any person from any inadvertent error in the information contained in this report.
Angel Broking Pvt. Limited has not independently verified all the information contained within this document. Accordingly, we cannot
testify, nor make any representation or warranty, express or implied, to the accuracy, contents or data contained within this document.
While Angel Broking Pvt. Limited endeavors to update on a reasonable basis the information discussed in this material, there may be
regulatory, compliance, or other reasons that prevent us from doing so.
This document is being supplied to you solely for your information, and its contents, information or data may not be reproduced,
redistributed or passed on, directly or indirectly.
Neither Angel Broking Pvt. Limited, nor its directors, employees or affiliates shall be liable for any loss or damage that may arise from
or in connection with the use of this information.